Attempting to visualise how Co-operative Societies spread then consolidated through the 19th and 20th centuries was only partially successful.
The data available were rather lacking. For example, although the centres of both Perth and Stirling feature large former Co-operative shop buildings, neither Society had a record on Wikidata. Other places' Co-ops are probably still missing. A lot of years of inception and traces of closure/merger are also missing.
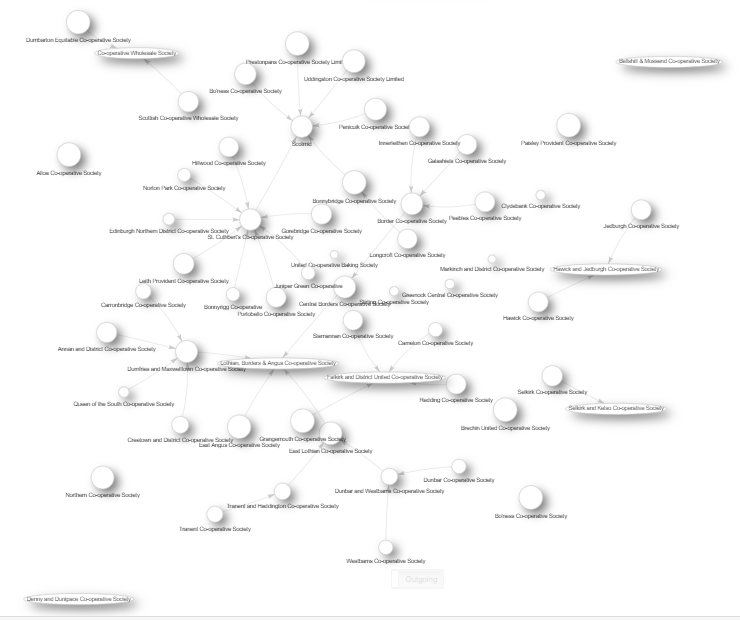
But the query yields a chart of sorts, allowing click exploration of the geographical spread and consolidation of societies.
Some thoughts on implications:
- When data are deficient, does diagramming provide benefit? The main use of tabular or map-based review is possibly to find gaps where data might be remediated.
- Searching for reference sources can be frustrating. For example, there may be traces of local coverage - such as an exhibition of artefacts from Greenock Central Co-operative Society - which provide the year when the Society was created, its subsequent expansion, but often silent on the run-down of the Society and its fate.
- This form of exploration requires the existence of granular data at a level beneath Wikipedia. English Wikipedia does have articles on larger Societies, but most here would fail the Company Notability criteria and, at best, could be added to the History or Economy section of the headquarters town's article. So any level of diagram exploration into a topic requires more Wikidata items without corresponding Wikipedia articles.